Extras din seminar
Fisiere help pentru functii si calcule de estimare in Excel (de probat functiile!)
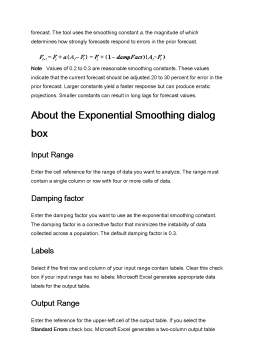
Din Tools-Data Analysis- se vor studia aplicatiile: Regression, Correlation, Covariance, Exponential Smoothing;
Din functiile statistice se vor parcurge: Correlation, Covariance, Intercept, linest, logest, slope, trend, forecast, growth, RSQ, Pearson.
Mai jos sunt selectate helpurile aferente din Excel. Incercati sa faceti toate exemplele, chiar daca sunt mai mult economice, chiar incercati sa concepeti dupa acelasi model exemple cu calitatea si fiabilitatea!
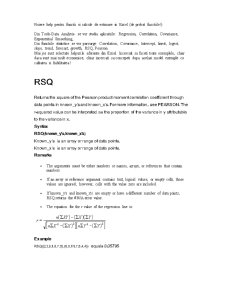
RSQ
Returns the square of the Pearson product moment correlation coefficient through data points in known_y's and known_x's. For more information, see PEARSON. The r-squared value can be interpreted as the proportion of the variance in y attributable to the variance in x.
Syntax
RSQ(known_y's,known_x's)
Known_y's is an array or range of data points.
Known_x's is an array or range of data points.
Remarks
. The arguments must be either numbers or names, arrays, or references that contain numbers.
. If an array or reference argument contains text, logical values, or empty cells, those values are ignored; however, cells with the value zero are included.
. If known_y's and known_x's are empty or have a different number of data points, RSQ returns the #N/A error value.
. The equation for the r value of the regression line is:
Example
RSQ({2,3,9,1,8,7,5},{6,5,11,7,5,4,4}) equals 0.05795
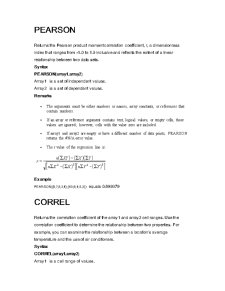
PEARSON
Returns the Pearson product moment correlation coefficient, r, a dimensionless index that ranges from -1.0 to 1.0 inclusive and reflects the extent of a linear relationship between two data sets.
Syntax
PEARSON(array1,array2)
Array1 is a set of independent values.
Array2 is a set of dependent values.
Remarks
. The arguments must be either numbers or names, array constants, or references that contain numbers.
. If an array or reference argument contains text, logical values, or empty cells, those values are ignored; however, cells with the value zero are included.
. If array1 and array2 are empty or have a different number of data points, PEARSON returns the #N/A error value.
. The r value of the regression line is:
Example
PEARSON({9,7,5,3,1},{10,6,1,5,3}) equals 0.699379
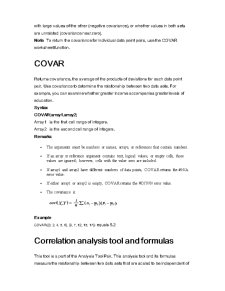
CORREL
Returns the correlation coefficient of the array1 and array2 cell ranges. Use the correlation coefficient to determine the relationship between two properties. For example, you can examine the relationship between a location's average temperature and the use of air conditioners.
Syntax
CORREL(array1,array2)
Array1 is a cell range of values.
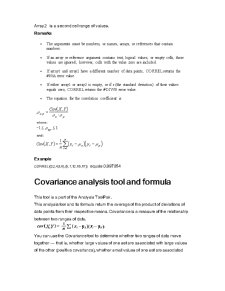
Array2 is a second cell range of values.
Remarks
. The arguments must be numbers, or names, arrays, or references that contain numbers.
. If an array or reference argument contains text, logical values, or empty cells, those values are ignored; however, cells with the value zero are included.
. If array1 and array2 have a different number of data points, CORREL returns the #N/A error value.
. If either array1 or array2 is empty, or if s (the standard deviation) of their values equals zero, CORREL returns the #DIV/0! error value.
. The equation for the correlation coefficient is:
Example
CORREL({3,2,4,5,6},{9,7,12,15,17}) equals 0.997054
Preview document


Conținut arhivă zip
- Functii in Excel.doc
Alții au mai descărcat și

1. Introducere în analiza de corelatie O legatura statistica (stochastica) are loc atunci când modificarea unei variabile este rezultatul conjugat...

1.1 Introducere in SPSS. SPSS (Statistical Package for the Social Sciences) este un program puternic si utilizat .Acest pachet integrat asigura...

Introducere în statistică Definiţia statisticii Una din definiţiile care pot fi găsite în Dicţionarul explicativ al limbii române (DEX) pentru...

CE NE PROPUNEM? ASPECTE DE AVUT ÎN VEDERE LA ALEGEREA UNEI TEME DE STUDIU - Dacă tema prezintă interes pentru student/masterand/doctorand; -...

1. Noţiuni generale Editorul de texte Microsoft Word face parte din pachetul Microsoft Office. Lansarea în execuţie a utilitarului Microsoft Word...

Modul 1. Aspecte elementare 1.1. Baze de date şi sistem de gestiune a bazelor de date (SGBD) În esenţă o bază de date reprezintă informaţii...

Sursa nodurilor Sursa nodurilor permite importarea datelor din fisiere de tip text, SPSS, SAS, Excel, ODBC – baze de date relaŃionale: Nod ce...

AMR este producătorul uneia dintre cele mai rapide şi eficiente linii de soluţii de securitate a datelor atestate pe plan internaţional. Încă de la...
Te-ar putea interesa și

CAPITOLUL 1. NOTIUNI INTRODUCTIVEUT 4CAPITOLUL 1. NOTIUNI INTRODUCTIVE In ultimele decenii, calculatoarele si-au exercitat pionieral in numeroase...

1. CONSIDERENTE GENERALE ROMSOFT este o societate cu capital 100% romanesc, unul din cei mai importanti distribuitori de tehnica de calcul din...


Introducere. Concepte de baza. Una dintre cele mai frecvente utilizari ale calculatoarelor o constitue prelucrarea textelor. Tehnoredactarea este...

Memorarea informatiei Capacitatea de stocare a informatiei si viteza de acces la date constituie criterii de baza pentru aprecierea performantelor...

1. Sistemul de operare cuprinde, în principal, urmatoarele categorii de programe: I. programe de control si comanda II. editoare de texte si...

Bazele informaticiiTrue/False Atunci cand o formula contine, direct sau indirect, adresa propriei celule, aceasta este numita adresa circulara.A...

AVERAGE (x1, x2,…, xn) Media aritmetica a numerelor m = (x1+ x2 + … + xn) / n SUM(x1, x2,…, xn) Suma aritmetica a numerelor s = x1+ x2 + … + xn...