Cuprins
- I. INTRODUCTION
- II. HYPOTHESIS TESTING
- III. LINEAR SIMPLE REGRESSION
- IV. LINEAR MULTIPLE REGRESSION
- V. CONCLUSION
- VI. ANEXES
Extras din referat
INTRODUCTION
Regression analysis is mainly concerned with the study of the dependence of one variable (the dependent variable), on one or more other variables (the explanatory variables), in order to estimate and predict the mean value of the former in terms of the known values of the latter. A simple linear regression model attempts to explain the relationship between two variables using a straight line.
Multiple linear regression attempts to model the relationship between two or more explanatory variables and a response variable by fitting a linear equation to observed data. Every value of the independent variable x is associated with a value of the dependent variable y.
The purpose of this project is to determine whether there is a correlation between the monthly value of GDP starting in January 2007 and ending in October 2012 in United States of America (the dependant variable) and the unemployment rate (the independent variable) - for the scope of conducting a simple regression - and, moreover, for conducting a multiple one, we are adding also the inflation rate for each month starting the year 2007 and ending in October 2012 (also independent variable).
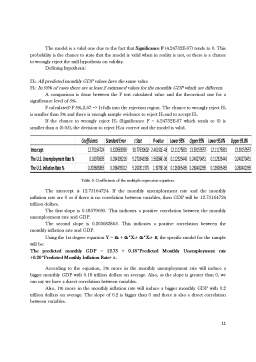
The purpose of this paper is to find a correlation between these variables, meaning the strength of their relationship, or the degree of linear association. We shall also test the significance of the coefficients, the validity of the model through different methods such as F Test and p Value and we will draw conclusions regarding the autocorrelation and the heteroscedasticity/ homoscedasticity of the model.
The most important and relevant information needed for conducting such a test is gathering the necessary data in order to process the simple and the multiple regressions. In our case, data has been obtained from a single source, this being http://www.y.charts.com. The study was conducted on all 70 months during the period between the years Jan. 2007 - Oct. 2012, having the year 2007 as reference year for the accumulated data. In the following rows, there are some briefly details upon our dependent and independent variables that the study consists of:
Y= The value of the monthly GDB =dependent variable: it represents the primary indicator used to gauge the health of a country's economy and the total U.S. dollar value of all goods and services produced over a specific time period - it is practically the size of the economy;
X1= The value of the monthly Unemployment Rate (%) =independent variable: it represents the percentage of the total labor force that is unemployed but actively seeking employment and willing to work. This indicator is considered a lagging indicator, confirming but not foreshadowing long-term market trends;
X2= The value of the monthly Inflation Rate (%) =independent variable: it represents the rate at which the general level of prices for goods and services is rising and, subsequently, purchasing power is falling.
The gathered data helps us in stating the relevance of the correlation between the monthly GDP and influencing factors such as: monthly unemployment rate and monthly inflation rate. This relationship is important for policy makers in order to obtain a sustainable rise in living standards. If GDP growth rate is below its natural rate, it is indicated to promote employment because this rise in total income will generate inflationary pressures. In contrast, if the GDP growth rate is above its natural level, policy makers will decide not to intensively promote the creation of new jobs in order to obtain a sustainable growth rate which will not generate inflation.
HYPOTHESIS TESTING
Hyptothesis 1
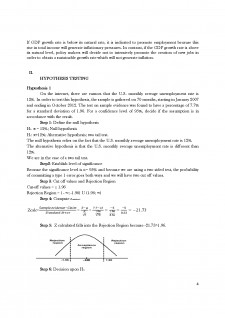
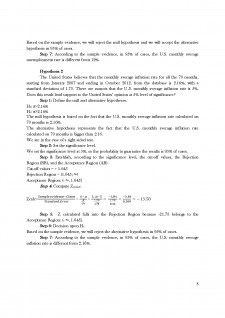
On the internet, there are rumors that the U.S. monthly average unemployment rate is 12%. In order to test this hypothesis, the sample is gathered on 70 months, starting in January 2007 and ending in October 2012. The test on sample evidence was found to have a percentage of 7.7% for a standard deviation of 1.96. For a confidence level of 95%, decide if the assumption is in accordance with the result.
Step 1: Define the null hypothesis
H0: π = 12%; Null hypothesis
H1: π≠12%; Alternative hypothesis; two tail test.
The null hypothesis relies on the fact that the U.S. monthly average unemployment rate is 12%.
The alternative hypothesis is that the U.S. monthly average unemployment rate is different than 12%.
We are in the case of a two tail test.
Step2: Establish level of significance
Because the significance level is α= 95% and because we are using a two sided test, the probability of committing a type 1 error goes both ways and we will have two cut off values.
Step 3: Cut off values and Rejection Region
Cut-off values = ± 1.96
Rejection Region = ( - ∞; -1.96) U (1.96; ∞)
Step 4: Compute zcalculated.
Zcalc=(Sample evidence-Claim)/(Standard Error) = (x ̅- µ)/(σ/√n) = (7.7-12)/(1.96/√70)=(-5)/(1.96/8.36)=(-5)/0.23=-21.73
Step 5: Z calculated falls into the Rejection Region because -21.73>1.96.
Step 6: Decision upon H0.
Based on the sample evidence, we will reject the null hypothesis and we will accept the alternative hypothesis in 95% of cases.
Step 7: According to the sample evidence, in 95% of cases, the U.S. monthly average unemployment rate is different from 12%.
Preview document


Conținut arhivă zip
- Econometrics.docx
Alții au mai descărcat și

Analiza macro-mediului intreprinderii Studiul macro-mediului intreprinderii permite depasirea orizontului mediului concurential deoarece...

In era globalizarii, specialitii in domeniu vorbesc despre “intreprinderea digitala”, “intreprinderea virtuala” sau “intreprinderea mileniului...

Reforme institutionale si politice in U.E. inaintea procesului de largire. Actuala forma de organizare ce cuprinde 15 tari membre nu mai...
Te-ar putea interesa și

Introducere Analiza de mediu de afaceri reprezintă un subiect de interes atât pentru companii cât și pentru clienții acestora.Însă diferența...

INTRODUCERE Studierea mecanismelor şi a politicilor de reglare a cererii şi ofertei de forţa de muncă în perioada de tranziţie la economia de...

Paritatea ratelor de dobândă.Condiţia de bază în ceea ce priveşte echilibrul Piaţa valutară este în echilibru atunci când depozitele în orice...

Introducere O componentă importantă a pieței factorilor de producție este piața muncii. Ea deține o poziție centrala în sistemul de piețe. Piața...

1. Descrierea fenomenului: Turismul La nivel mondial, turismul este considerat unul dintre cele mai dinamice sectoare ale economiei, evoluția sa...

I. Caracteristicile pieței financiar-bancare din România 1.1. Structura sistemului financiar din România Gradul de intermediere financiară s-a...

Prezentarea datelor Statele Unite dispun de aproximativ 330 de instalații comerciale de îmbuteliere a laptelui și aproape 1.600 de fabrici de...

1. Introducere Riscul de faliment reprezintă posibilitatea de apariție a incapacitatii de achitare a tuturor datoriilor scadente ca urmare a...