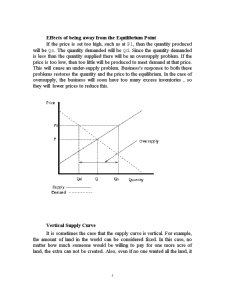
Extras din referat
In economics, supply and demand means the relationship between the quantity that producers wish to sell at various prices and the quantity of a commodity that consumers wish to buy.
The quantity of a commodity demanded can be seen to depend on the price of that commodity, the prices of all other commodities, the incomes of consumers, and their tastes. In economic analysis, the last three factors are often held constant . Then the analysis involves examining the relationship between various prices and the maximum quantity that would be purchased at each of these prices. These price-quantity combinations may be plotted on a curve, known as a demand curve.
The quantity of a commodity that is available in the market depends not only on the price obtainable for the commodity, but also on the prices of substitutable products, the techniques of production, and the availability and costs of labor and other factors of production. In analyzing supply , one usually assumes that all but the price are constant in order to observe the relationship between various prices and the quantity potentially offered by suppliers at each price.
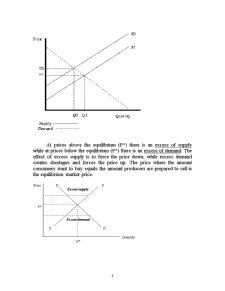
The function of a market is to equate demand and supply through the price mechanism. If buyers wish to purchase more of a commodity than is available at the prevailing price, they will tend to bid the price up. If they wish to purchase less than is available at the prevailing price, suppliers will bid prices down. Thus, there is a tendency toward an equilibrium price, at which the quantity demanded is just equal to the quantity supplied.
As the price rises, the quantity offered usually increases, and the willingness of consumers to buy an article normally declines, but these changes are not necessarily proportional.
Demand curve shifts
The demand curve is a graphic representation of the relationship between the price of the product and the quantity of the product demanded. It is drawn with price on the vertical axis of the graph and quantity demanded on the horizontal axis. With few exceptions, the demand curve is delineated as sloping downward from left to right because price and quantity demanded are inversely related (i.e., the lower the price of a product, the
Higher the demand or number of sales). This relationship is contingent on certain ceteris paribus (other things equal) conditions remaining constant. Such conditions include the number of consumers in the market, consumer tastes or preferences, prices of substitute goods, consumer price expectations, and personal income. A change in one or more of these conditions causes a change in demand, which is reflected by a shift in the location of the demand curve. A shift to the left indicates a decrease in demand, while a movement to the right indicates an increase.
In the figure below an increase in price results in a movement up the demands curve. The fall in the quantity demanded from Q1 to Q2 is sometimes called a contraction in demand. A demand curve shifts only if there is a change in income, in taste or in the demand for substitutes or complements. In the diagram below a decrease in demand has shifted the demand curve to the left. The new demand curve is D1 .
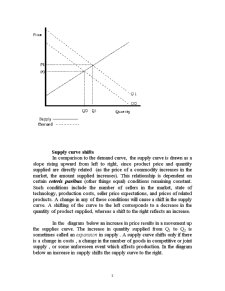
Supply curve shifts
In comparison to the demand curve, the supply curve is drawn as a slope rising upward from left to right, since product price and quantity supplied are directly related (as the price of a commodity increases in the market, the amount supplied increases). This relationship is dependent on certain ceteris paribus (other things equal) conditions remaining constant. Such conditions include the number of sellers in the market, state of technology, production costs, seller price expectations, and prices of related products. A change in any of these conditions will cause a shift in the supply curve. A shifting of the curve to the left corresponds to a decrease in the quantity of product supplied, whereas a shift to the right reflects an increase.
In the diagram below an increase in price results in a movement up the supplies curve. The increase in quantity supplied from Q1 to Q2 is sometimes called an expansion in supply . A supply curve shifts only if there is a change in costs , a change in the number of goods in competitive or joint supply , or some unforeseen event which affects production. In the diagram below an increase in supply shifts the supply curve to the right.
Preview document


Conținut arhivă zip
- Supply and Demand.doc
Alții au mai descărcat și

Analiza macro-mediului intreprinderii Studiul macro-mediului intreprinderii permite depasirea orizontului mediului concurential deoarece...

In era globalizarii, specialitii in domeniu vorbesc despre “intreprinderea digitala”, “intreprinderea virtuala” sau “intreprinderea mileniului...

Reforme institutionale si politice in U.E. inaintea procesului de largire. Actuala forma de organizare ce cuprinde 15 tari membre nu mai...
Te-ar putea interesa și

History Ancient times Summer developed a large scale economy based on commodity money, while the Babylonians and their neighboring city states...

1. MARKET AREA The market stretches on the geographic territory of Romania, as the following map describes. Geographical Chocolate Consumption...

Introduction Since the emergence of international trade, shipping played a important rol in his development. Currently, over 70% of the volume of...

Aggregate supply and aggregate demand Aggregate Supply Having looked at the components of aggregate demand, we now turn to the supply-side of the...

Supply and Demand: Gas Prices Demand for gas, in the summer of 2005, was bigger than ever. It is well known that when people on vacation use a...

The price P of a product is determined by a balance between production at each price (supply S) and the desires of those with purchasing power at...

What is Broad Money? At the outset, ‘money’ needs to be defined, and this is traditionally done through its principal function — a medium of...

Price Elasticity Introduction Businesses know that they face up with demand curves, but rarely they do know what these curves look like. Yet...